The Boston Consulting Group (BCG) Growth Share Matrix efficiently and effectively identifies if investments should be made into a product or service, or if a product or service should be retired from the market. Although there are some limitations of the BCG Growth Share matrix, which we will discuss, this matrix is an excellent first step to help identify where product dollars should be allocated or removed.
BCG Growth Share Matrix Overview
The BCG Growth Share Matrix is a planning tool, which categorizes products and services into one of four quadrants, to identify how they are performing from a growth perspective, and relative to their market. The tool guides the evaluation of products and services, based on market growth potential and competitive position in the marketplace. This allows organizations to determine where they should be investing, and when it is beneficial to retire products or services, or to decrease investment in them.
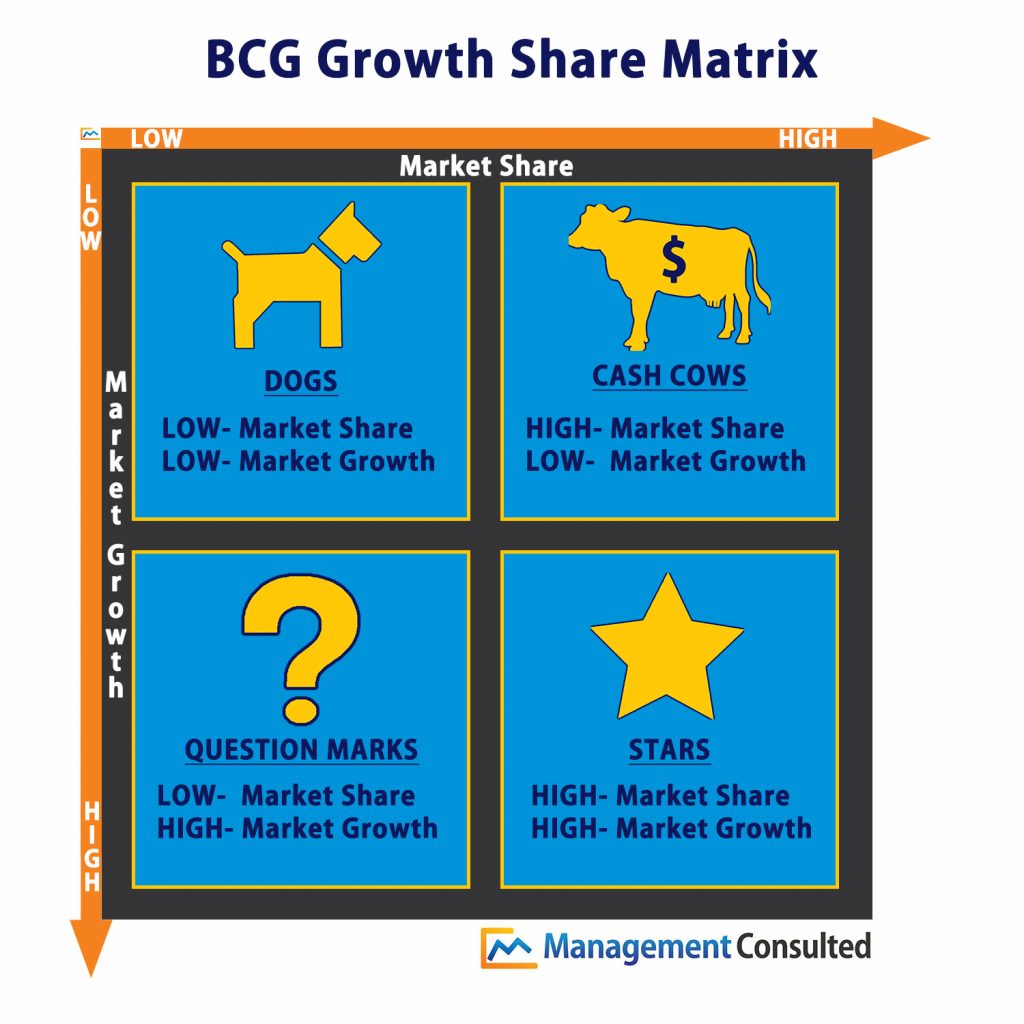
The BCG Growth Share Matrix categories include Stars, Question Marks, Cash Cows and Dogs. Products and Services are allocated to each quadrant based on market share and profitability. There is an example of the BCG Growth Share Matrix below for your reference.
[globalcta id="CTA-CorpTraining-v1"]
The Four Quadrants in the BCG Growth Share Matrix are:
Stars:
Stars are the highest performing products and services. They have the greatest growth potential and market share. They are generally products and services that warrant continued investment, given their performance in the market.
Question Marks:
Question Marks perform similarly, but are yet to prove their worth. They inhabit a high growth market, but currently hold a low market share.
Cash Cows:
While these products and services do not have high growth potential, they do possess a large market share.
Dogs:
Dogs exhibit both a low market share and little potential for growth, and should often be the first on the list to be retired or divested.
BCG Growth Share Matrix Example
In the below BCG Growth Share Matrix company example, Charter Communications products are placed in each BCG Growth Share Matrix quadrant. Charter Communications, Inc. is a mass media and telecommunications company (marketed to consumers under its brand name Spectrum), and is second only to Comcast as the leading cable operator in the United States.
Cable and Internet are Cash Cows for Charter, given their large share in a highly saturated market. This saturation makes growth more challenging, given the prevalence of streaming services such as Netflix, Hulu, and Amazon.
Charter has begun offering a mobile option (which would be a Question Mark) in a very saturated market, competing with AT&T and Sprint. Charter is also targeting its consumers with “bundle” services to reduce costs. These services would be Question Marks, as it is underdetermined if consumers would see the need to keep landlines working as part of the bundle, considering the proliferation of mobile phones.
Voice in its traditional sense has seen a dramatic drop in usage, as most Americans rely on their mobile devices, rendering landlines nearly obsolete. Voice would be a Dog for Charter. It is used largely by consumers in bundle offerings, where consumers require internet and other services, and its inclusion is compulsory.
Charter is likely looking to offer other options, to differentiate themselves and compete in a competitive, ever-evolving space. They do not appear to have a clear “Star” in their repertoire, and they are heavily promoting “bundles”.
DOGS
- Voice
CASH COWS
- Cable
- Internet
QUESTION MARKS
- Mobile
- Bundling
STARS
- None
Explain The Matrix to Your Team
The BCG Growth Share Matrix serves as an excellent tool to determine how an organization’s products and services are performing in the marketplace, and whether or not money should be spent to keep them alive or retire them. There are, however, limitations associated with this model. For example, in the aforementioned case of Charter, it may be tempting to divest of Voice, but there are elderly consumers that still appreciate using a home phone. Therefore, it is likely worth the cost to maintain existing infrastructure to include Voice in a bundled deal for these consumers. The BCG Growth Share Matrix does not, and cannot, take into account all aspects of an organization’s products and services including cost and customer appeal.
Final Thoughts
Use of the BCG Growth Share Matrix is an excellent way to begin evaluating an organization’s product and service portfolio. It identifies how a product or service is performing in the market from a market share and a growth perspective. Just as the BCG Growth Share Matrix example above illustrates, the BCG Growth Share Matrix cannot take into account all aspects of product or service viability. Completing the matrix allows an organization to identify its top performing products and services and those that may no longer be serving the organization well. The BCG Growth Share Matrix generates additional questions whose answers drive the product delivery cycle including the management, development, and retirement of products and services.
[globalcta id="CTA-CorpTraining-v1"]