Correlation vs. causation is important to understand for anyone analyzing an organization’s data. These two terms are closely related, making them easy to confuse. However, the implications they have for a company’s data are significantly distinct.

Correlation vs. Causation Definition
Let’s look at the correlation vs. causation definitions. It’s important to note that these are two statistical measures that can exist at the same time, but are not the same thing. You may have heard the common phrase in statistics, “correlation does not imply causation.” It’s possible, even common, to find a solid correlation between two variables that are not connected in a “cause and effect” relationship.
Causation Definition
Let’s start with a definition of causation. Causation simply means that one event is causing another event to happen - Variable A causes variable B to occur. It’s a common mistake to see a pattern in the data and mistake that pattern for causation. Just because two variables are related does not mean that one causes the other. That brings us to our next term: correlation.
[optin-monster slug="oa6kdflxsmp4bi4azzgi" followrules="true"]
What Is Correlation?
What is correlation? A correlation indicates there is a relationship between two events, but one is not necessarily caused by the other. Variables A and B occur together, but the reason is unclear.
Two things to take into account when looking at correlations are direction and size. Correlations can be positive or negative, which is represented by the direction they appear on a graph.
-
- Positive correlation: The variables move in the same direction. As one increases, so does the other.
- Negative correlation: The variables move in different directions. As one increases, the other decreases and vice versa.
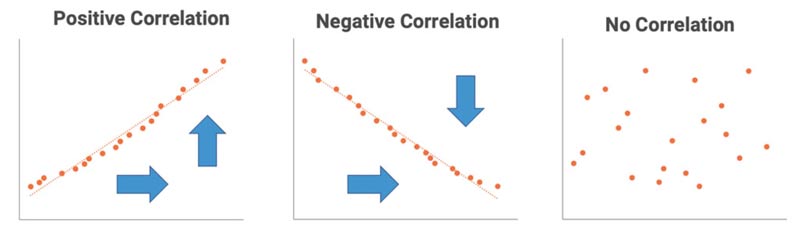
Source: emplifi.io
Correlation size measures the degree by which two variables are associated. Correlations can be weak, strong, or perfect.
-
- Weak: Data is all over the place, but is starting to represent a line
- Strong: A clearer line is represented
- Perfect: Data is in a perfect line
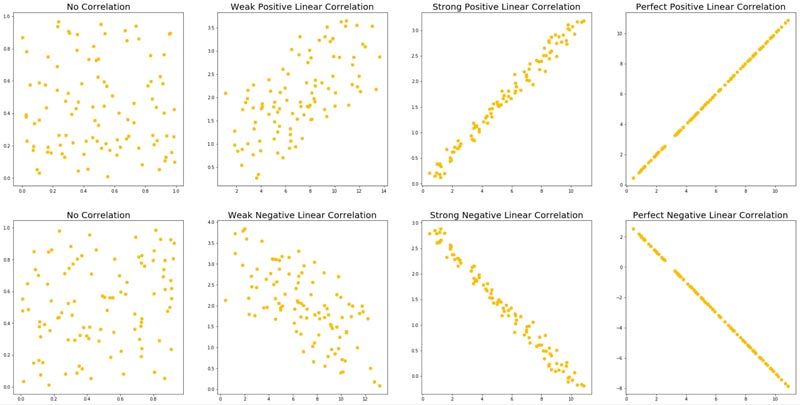
Source: Coding with Max
Correlation vs Causation Examples
Correlations are often mistaken for causations. The reason it’s important to distinguish between correlation vs. causation is because there may be other reasons two variables are occurring together. Amplitude lists four:
- Instead of variable A causing B, the opposite is true: B is causing A.
- Variables A and B are both being caused by a third variable, C.
- A causes B, but only when another variable, D, occurs.
- A chain reaction is occurring: A causes E, then E causes B.
Let’s look at some correlation vs. causation examples.
JMP gives a great example of correlation vs. causation in studying the causes of skin cancer. When looking at health data, there appears to be a positive correlation between exercise and skin cancer cases. It looks like people who exercise more also get skin cancer. In reality, people who live in places that experience more sunlight year-round tend to have more active lifestyles than people who don’t. Exercise does not cause skin cancer, but instead both of these variables were being affected by the third variable, sun exposure.
Clevertap gives another example of a correlation vs. causation example in marketing. A company redesigns their website and web page traffic increases. This could mean that web traffic increased because of the new design. However, it could also mean web traffic was organically up at that time.
Correlation vs Causation In Business
Being able to distinguish between correlation vs. causation in business and consulting is critical. A consultant’s job is to ask questions, look for patterns, and, ultimately, improve a business’s performance. No business wants to waste time and energy on actions that don’t lead to positive outcomes.
When collecting and interpreting company data, the main question to ask is: which action caused a desirable result? The answer is usually not one thing, but a combination of things that each adds to the final outcome. Companies want to know which processes and strategies are producing the results they want. This tells them where to direct additional training and effort.
Since a causal relationship can be difficult to ascertain, further research and additional testing are sometimes necessary. Randomized experiments and other statistical tests can help verify that one variable directly impacts another. It’s important to err on the side of skepticism and do further research before making bold claims.
Amplitude lists two types of experiments that can be used to identify causation: hypothesis testing and A/B/n experiments. Hypothesis testing involves testing at least two hypotheses (a null and a primary) to determine whether a relationship exists between two variables. A/B/n testing involves looking at both variables, changing one, and seeing what results. This is useful when comparing the effectiveness of different strategies.
Conclusion
The human mind is wired to find patterns even when they don’t exist. Honing the skill of interpreting data accurately can significantly increase your ability to help businesses succeed. Making the distinction between correlation vs. causation is a necessary part of this. This is especially true as a management consultant. Understanding the difference and implications of each will help demonstrate to firms that you have solid business acumen.
Additional Resources:
- Setting Business Goals: How To, Template, & Importance
- Resource Based View: Your Competitive Advantage In Focus
- What Is Business & How Do Consultants Help?
- Consulting Resume: Complete Guide