For as long as there have been teams of people working on shared projects, things have gone unexpectedly wrong. But simply knowing that something has gone wrong doesn’t necessarily tell you why the problem occurred or how to prevent it from occurring in the future. This is why managers all over the world have long relied on the fishbone diagram. It is a strategy for analyzing potential causes of a problem and understanding what to do about them.
What is Fishbone Diagram?
The fishbone diagram is a universal enough tool that, in fact, has many different names. Some people call it a cause-and-effect diagram. Many others call it an Ishikawa diagram, after an employee at the Kawasaki shipyards in the 1960s. Wait, so what is fishbone diagram exactly? In its most basic form, the definition of the fishbone diagram is: a causal analysis tool that starts with a problem and continues to unpeel the layers of root problems and their causes in order to figure out the true origin.
The reason this diagram is called a fishbone diagram is, you guessed it, that it looks like a fishbone. To construct a blank fishbone diagram, first draw a rectangle on the right side of your paper and inside it write the problem you’re trying to get to the bottom of. Now draw a horizontal arrow across the page pointing to the problem, with several diagonal arrows feeding into the horizontal one. These diagonal arrows all represent different categories of causes and should be labeled in correspondence with the categories. Feel free to get a head start by downloading our blank fishbone diagram.
Depending on the nature of the product or service you’re having a problem with, you might have a different set of cause categories. One sample group of categories is Methodologies, Machinery, Materials, Measurements, and the Environment.
[optin-monster slug="oa6kdflxsmp4bi4azzgi" followrules="true"]
Toyota Famously Relies On The 8 M's:
-
- Material
- Machine
- Method
- Manpower
- Measurement
- Milieu
- Management,
- Money Maintenance
If your problem has to do with marketing, you may want to fill your fishbone diagram template with the 8 P’s.
The 8 P's Of Marketing:
-
- Product
- Price
- Promotion
- Place
- People
- Process
- Packaging
- Physical Evidence
And if your problem is related to service, you should group causes under the 5 S’s.
The 5 S's Of Service:
-
- Suppliers
- Surroundings
- Systems
- Scope of Skills
- Standard Documentation
As you draw the arrows for these categories, think about how something to do with each category might have caused your main problem. Write it down next to the appropriate line. Then ask yourself: why? Why did that Cause happen and lead to that problem? Then you can write down the relevant Sub-causes. You can look for patterns in the fishbone diagram as you go, and this will help you understand what went wrong.
Fishbone Diagram Example
For our fishbone diagram example, we’re considering an imaginary problem encountered by Dunkin Donuts. After months of development and testing, the chain recently released a highly anticipated and heavily marketed new coffee product. However, revenues associated with the drink have not come close to what the company forecasted when it told shareholders about the beverage. So, after drawing out the fishbone diagram template, they look at various causes of the revenue issue and find that much of the problem is occurring downstream from effects of the coronavirus.
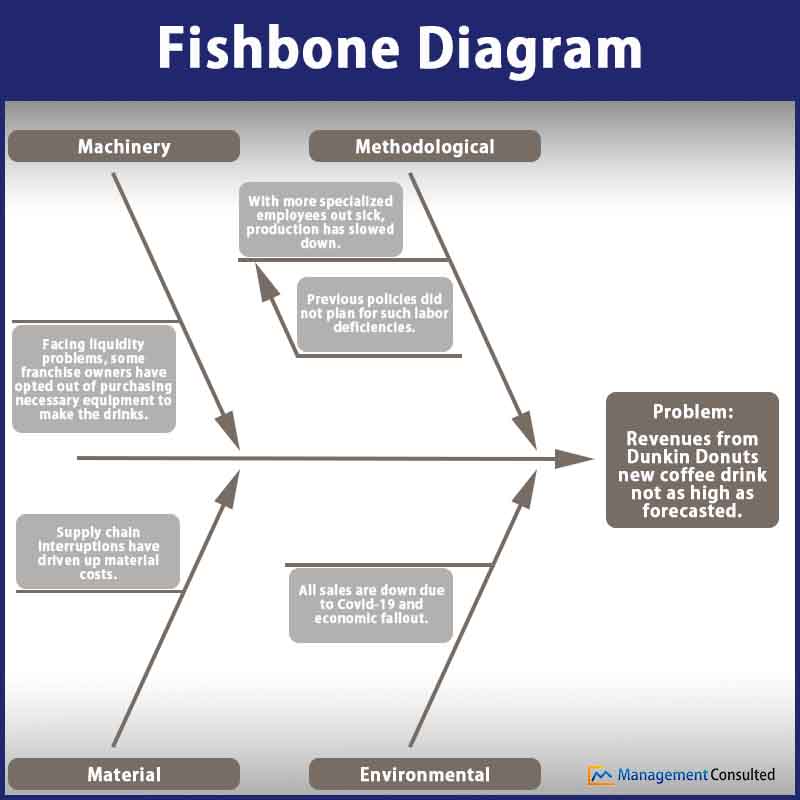
Feel free to download a blank Fishbone Diagram example to work your own problems. Add lines and labels as needed.
Fishbone Diagram Root Cause Analysis
Root cause analysis refers to the effort to understand deeper causes behind problems that show up in organizations and projects. Sometimes the problem at hand may have a few obvious causes. Stopping at the obvious causes can keep you from digging deeper to the root causes. Solving the intermediary causes of problems without working to solve and prevent the root causes doesn’t help to keep the problems from recurring in the future.
We can consider the fishbone diagram template a form of root cause analysis. The fishbone diagram is really nothing more than a tool for organizing your thinking. It can help individuals and teams see what kinds of deeper causes and patterns exist in the conditions that lead to larger problems. The fishbone diagram template also provides different categories of causes to help condense the material teams come up, which can be valuable but disorganized.
However, the main benefit of conducting the fishbone diagram is that it formalizes the process of asking why, why, and why until you follow a chain of cause and effect to a problem’s true beginning.
Get The Best Out Of Your Team - MC Corporate Training
Learn more about training for your team or organization
Conclusion
One of the most difficult aspects of managing a larger organization is that it can be difficult to pinpoint problems’ true causes. The process of blindly trying to chase after a problem can be maddening and fruitless. This is why the blank fishbone diagram is such a powerful tool and why fishbone diagram root cause analysis deservers more attention by business managers. It doesn’t require any special skills or education. It’s simply a tool for helping to make your problem-solving efforts more logical, and is a valuable addition to any manager’s toolkit.
Additional Reading:
- What is MECE?
- Influence Model: McKinsey's Change Management Model
- GE McKinsey Matrix
- BCG Matrix
- McKinsey Frameworks